
Finding performance bottlenecks in a CPU or React profile takes expertise. Handing the full profile to an agent can help, but it fills the context window and burns through tokens.
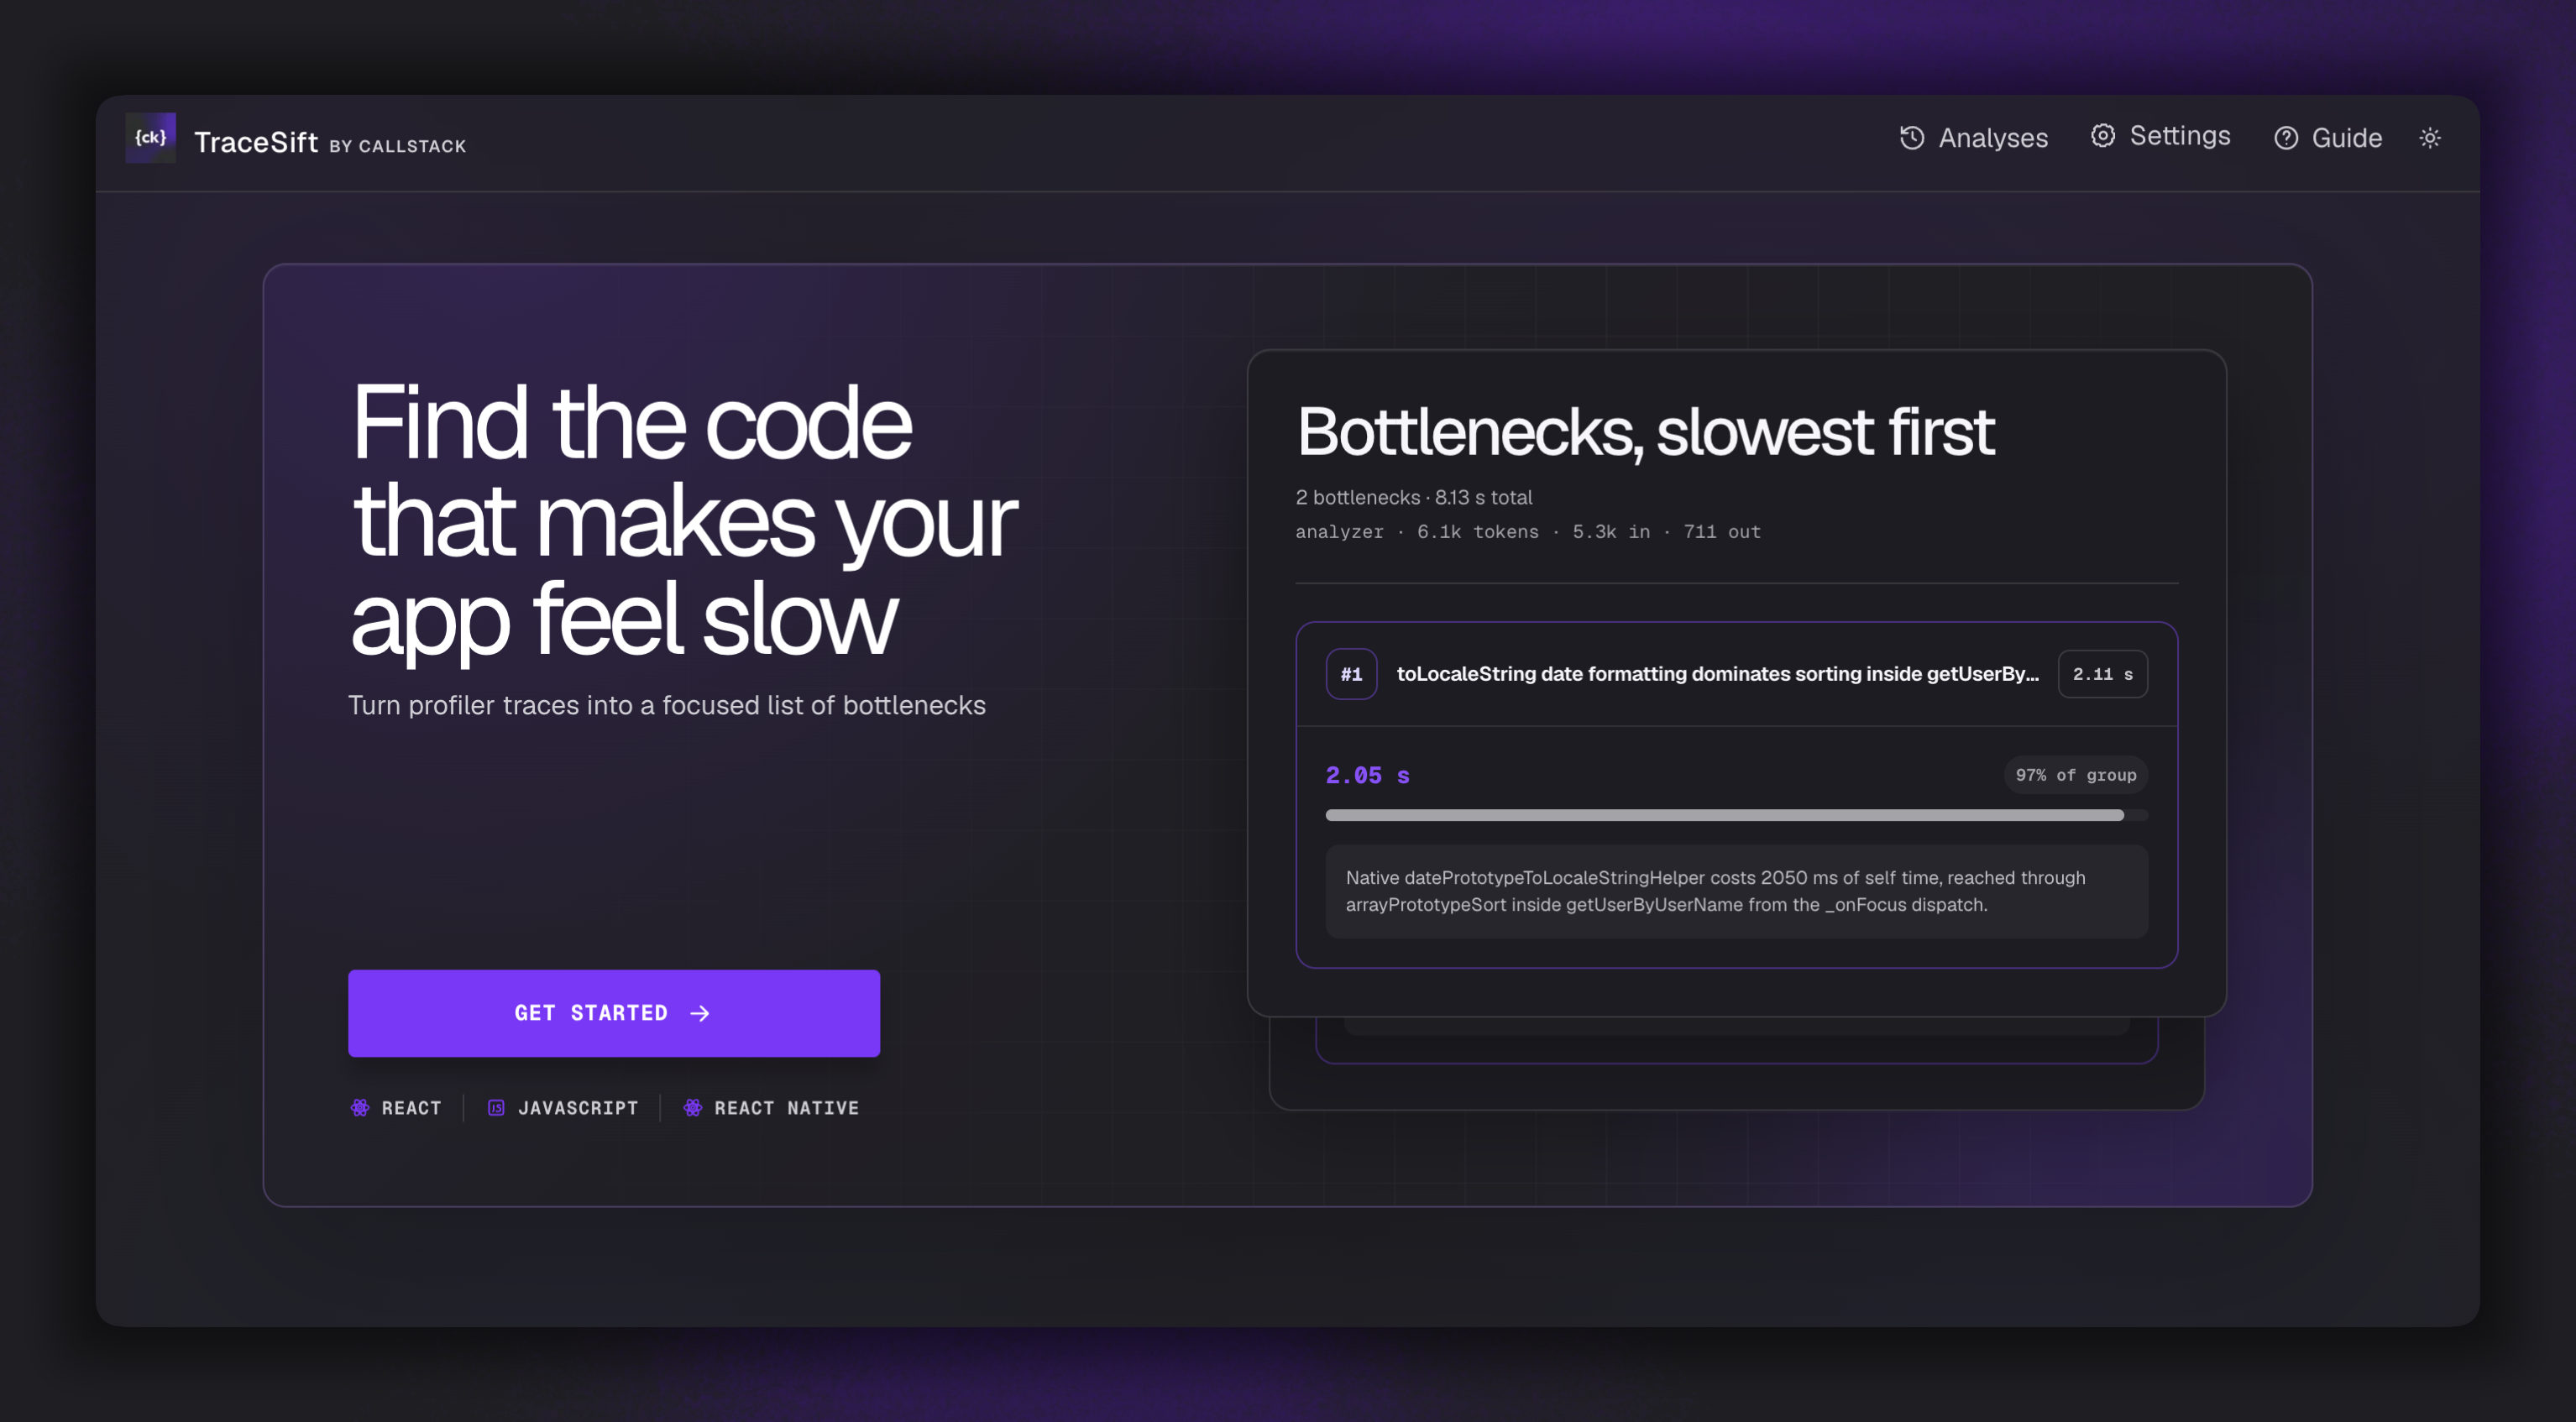
TraceSift identifies bottlenecks in your profile and presents them in a clear, readable format, with the slowest first. Every finding is measured rather than guessed: CPU and Hermes profiles are split into the tasks the trace recorded, React profiles into the commits React committed, so a card's duration is a block of time that really passed and its figures add up.
Each card carries a button to generate or copy a handoff prompt, so your agent can continue the investigation in the source code. You decide what gets fixed; the agent does the work.
Note
No model is needed to analyze a profile. A model is optional and used only where you ask for it — Explain with AI on a single card. Runs locally with OpenAI, Anthropic, or Callstack Apex, and your credentials stay with you.
npm install -g @callstack/tracesiftInstalls the TraceSift command globally. Requires Node.js 22.19 or newer and npm on macOS or Linux. The installed command does not need Git or build tools.
tracesift initRun this once to download and verify the prebuilt web app for your platform.
Important
After updating the CLI, run tracesift init again to install its matching app release.
tracesift startStarts TraceSift at http://127.0.0.1:3000 and opens it in your browser. Press Ctrl+C to stop the server.
See the CLI documentation for storage, troubleshooting, and release details.
Tip
Contributors can run npm run test:release:local to verify the packaged download and startup flow against a loopback artifact server before any GitHub release. See Contributing for the manual browser checkpoint and Changesets release process.
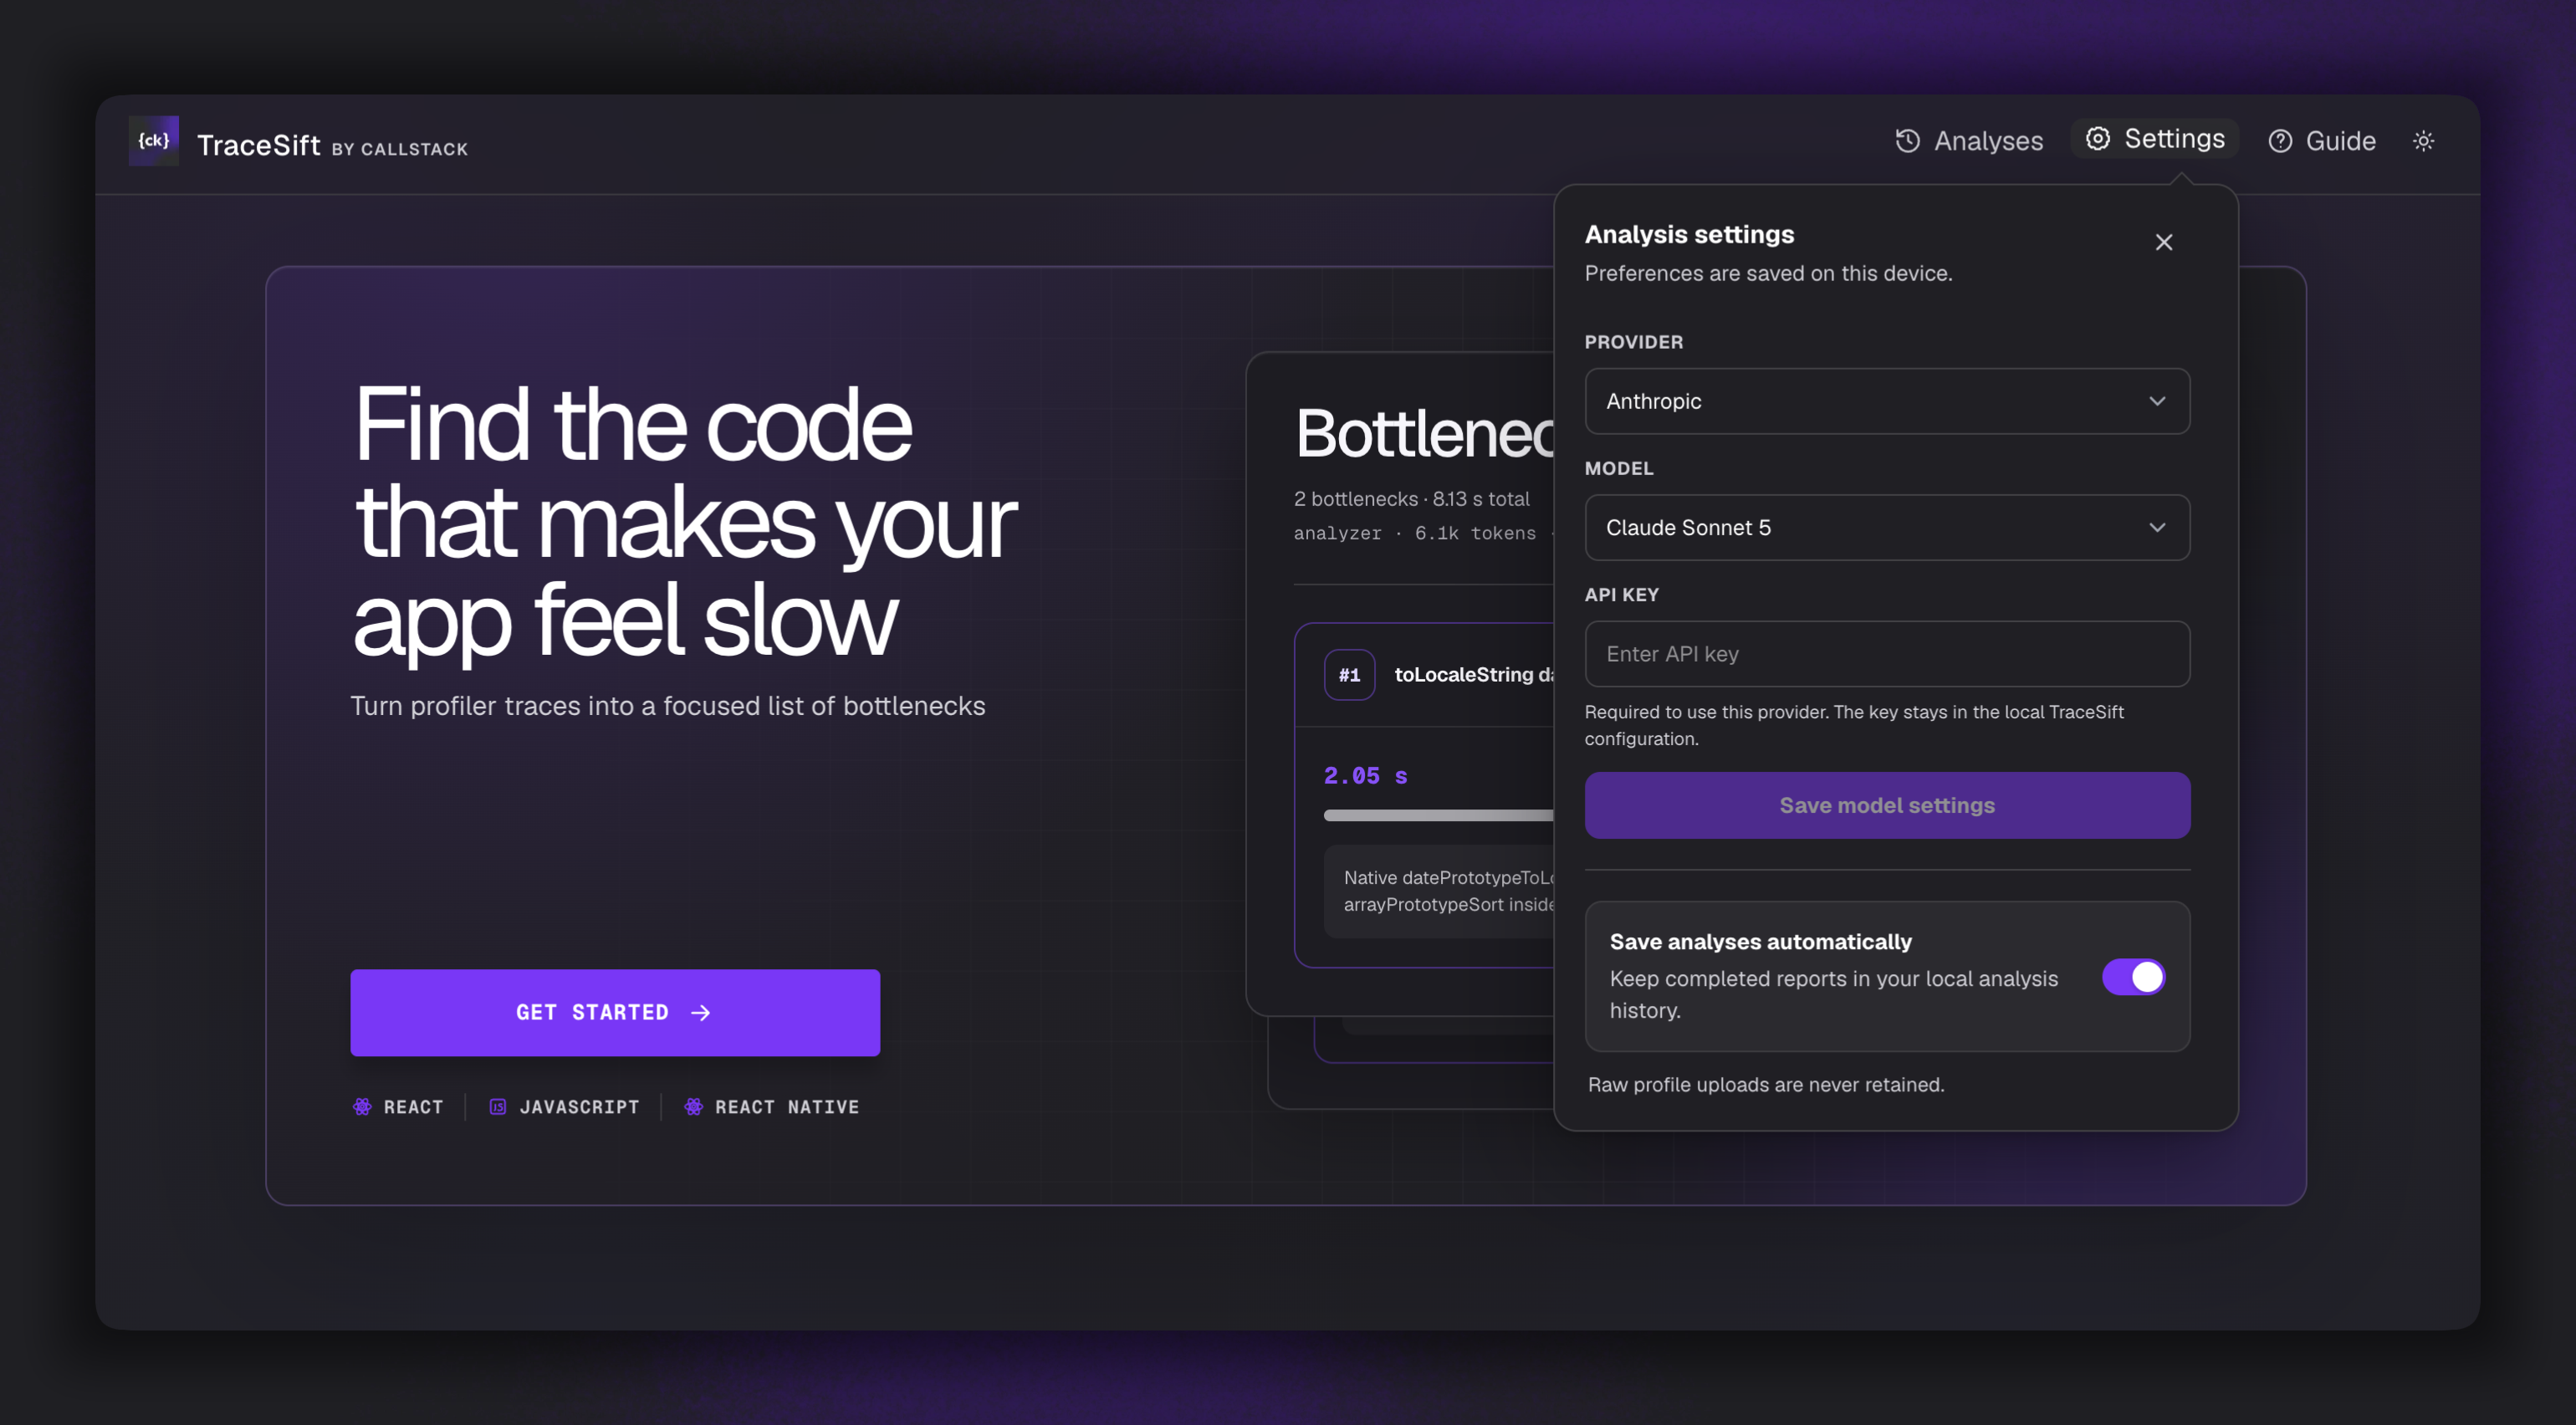
Without a provider configured, TraceSift still reads a profile end to end and produces its cards. Configure one for the optional extras:
- the per-card Explain with AI reading;
- a sharper split of which frames are your code rather than the framework's or the engine's.
Open Settings, choose a provider, authentication method, and model, then select Save model settings.
- OpenAI and Callstack use API keys;
- ChatGPT Codex uses Plus/Pro subscription sign-in;
- Anthropic supports a Claude subscription or API key;
- browser sign-in is available, and subscription sign-in uses PI OAuth experimentally;
- connecting an account does not select a model automatically;
- credentials stay in the local TraceSift home directory, and TraceSift never reads PI's own auth file.
Enable Save analyses automatically to keep completed reports in local history, or disable it and save individual reports from their results page.
Important
Nothing is applied until you select Save model settings.
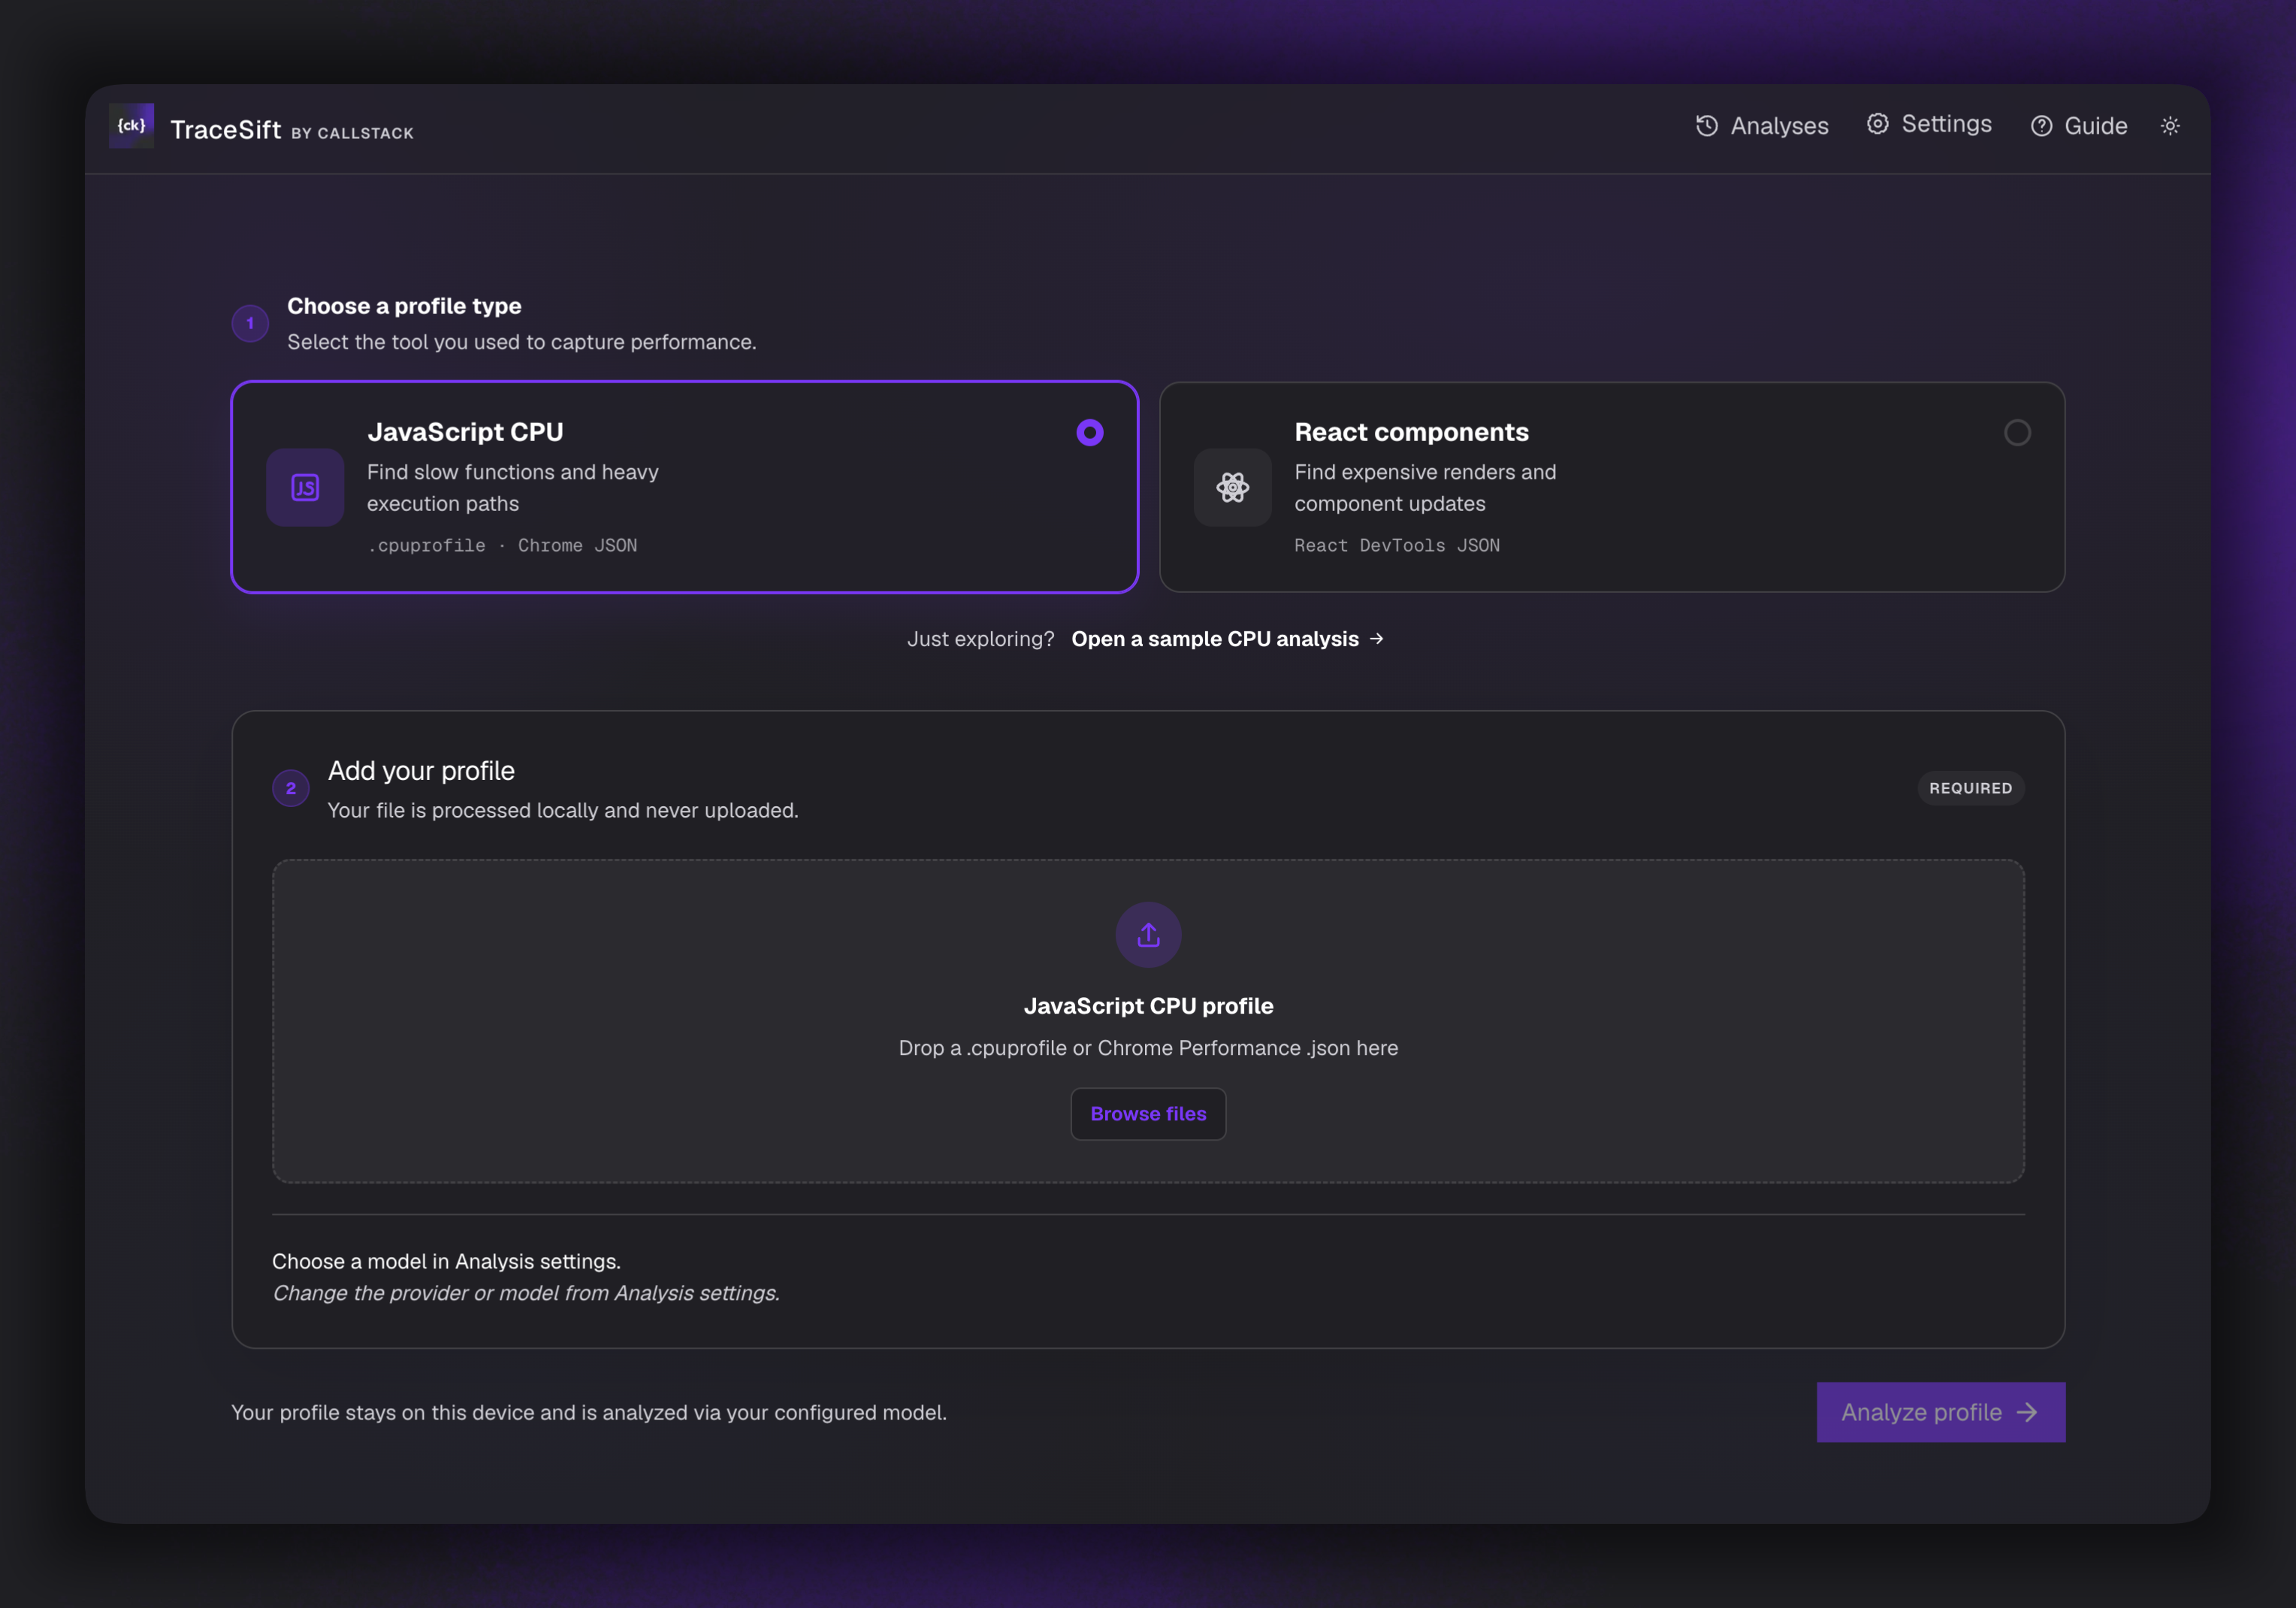
Select Get Started, choose the profile type that matches the profiler you used, then select Analyze Profile.
Tip
No profile at hand? Open a sample CPU analysis or Open a sample React analysis on the same screen loads a bundled recording with its cards, charts, prompts, and drill-down already in place.
Warning
Uploads are capped at 512 MB, the largest profile Node can still parse in one piece.
- Set
TRACE_SIFT_MAX_UPLOAD_MBbefore starting TraceSift to lower the cap; values above the ceiling are clamped. - TraceSift sizes its own heap for large profiles — up to 8 GB, and never more than half of physical memory. Setting
--max-old-space-sizethroughNODE_OPTIONSoverrides that.
One card per task, slowest first. A task is one block of main-thread work as recorded — Chrome's RunTask, or one top-level call in a Hermes duration trace — and tasks never overlap, so their shares add up. Each card carries:
- a heading naming the task and the feature it ran in;
- the culprits, ranked by the time they burned in their own body, each with the shape of how it burned it (
ran 125 times in this task · 140 ms total · longest single call 4 ms) and the named callers that reached it; - a chart of how that time is distributed across the task;
- a footnote describing the remainder, so a short list over a long task reads as cost spread thin rather than a short measurement.
Note
Where a trace carries no task boundaries, TraceSift splits sample runs on idle gaps and says on the card that the boundaries were inferred.
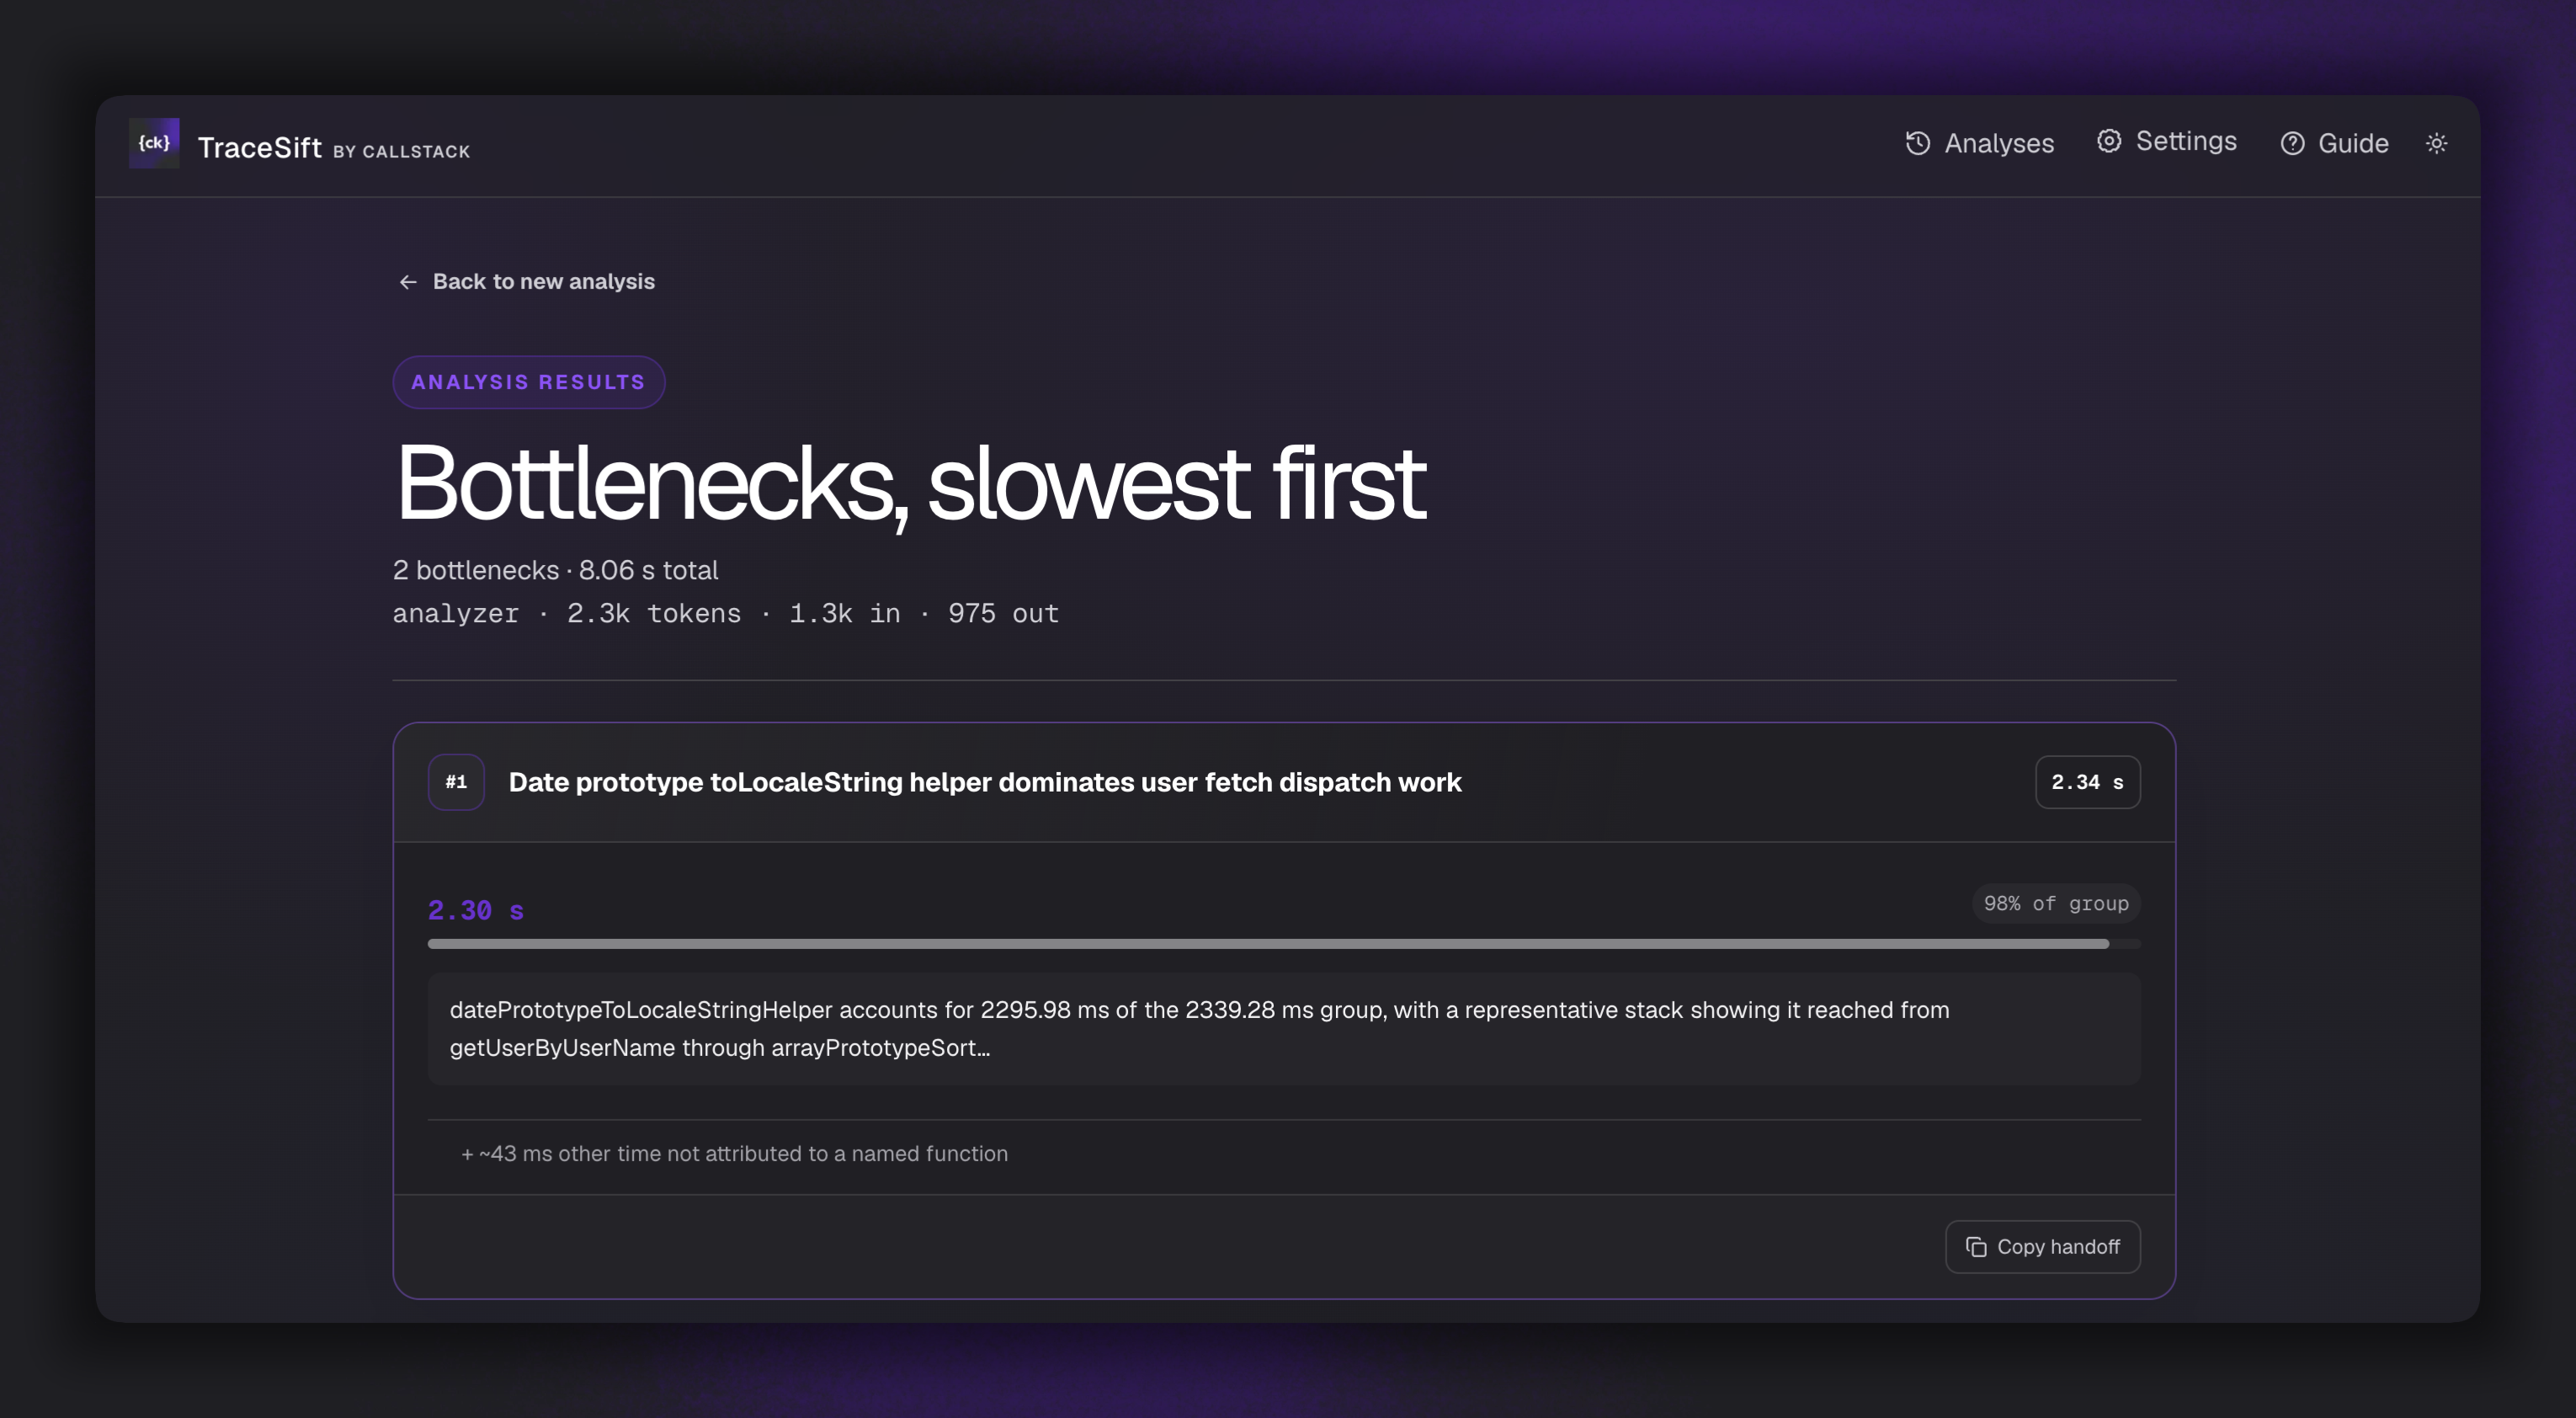
One card per commit, longest to render first. Each card names what the commit rendered, charts the components that held its time, and lists them with their render counts.
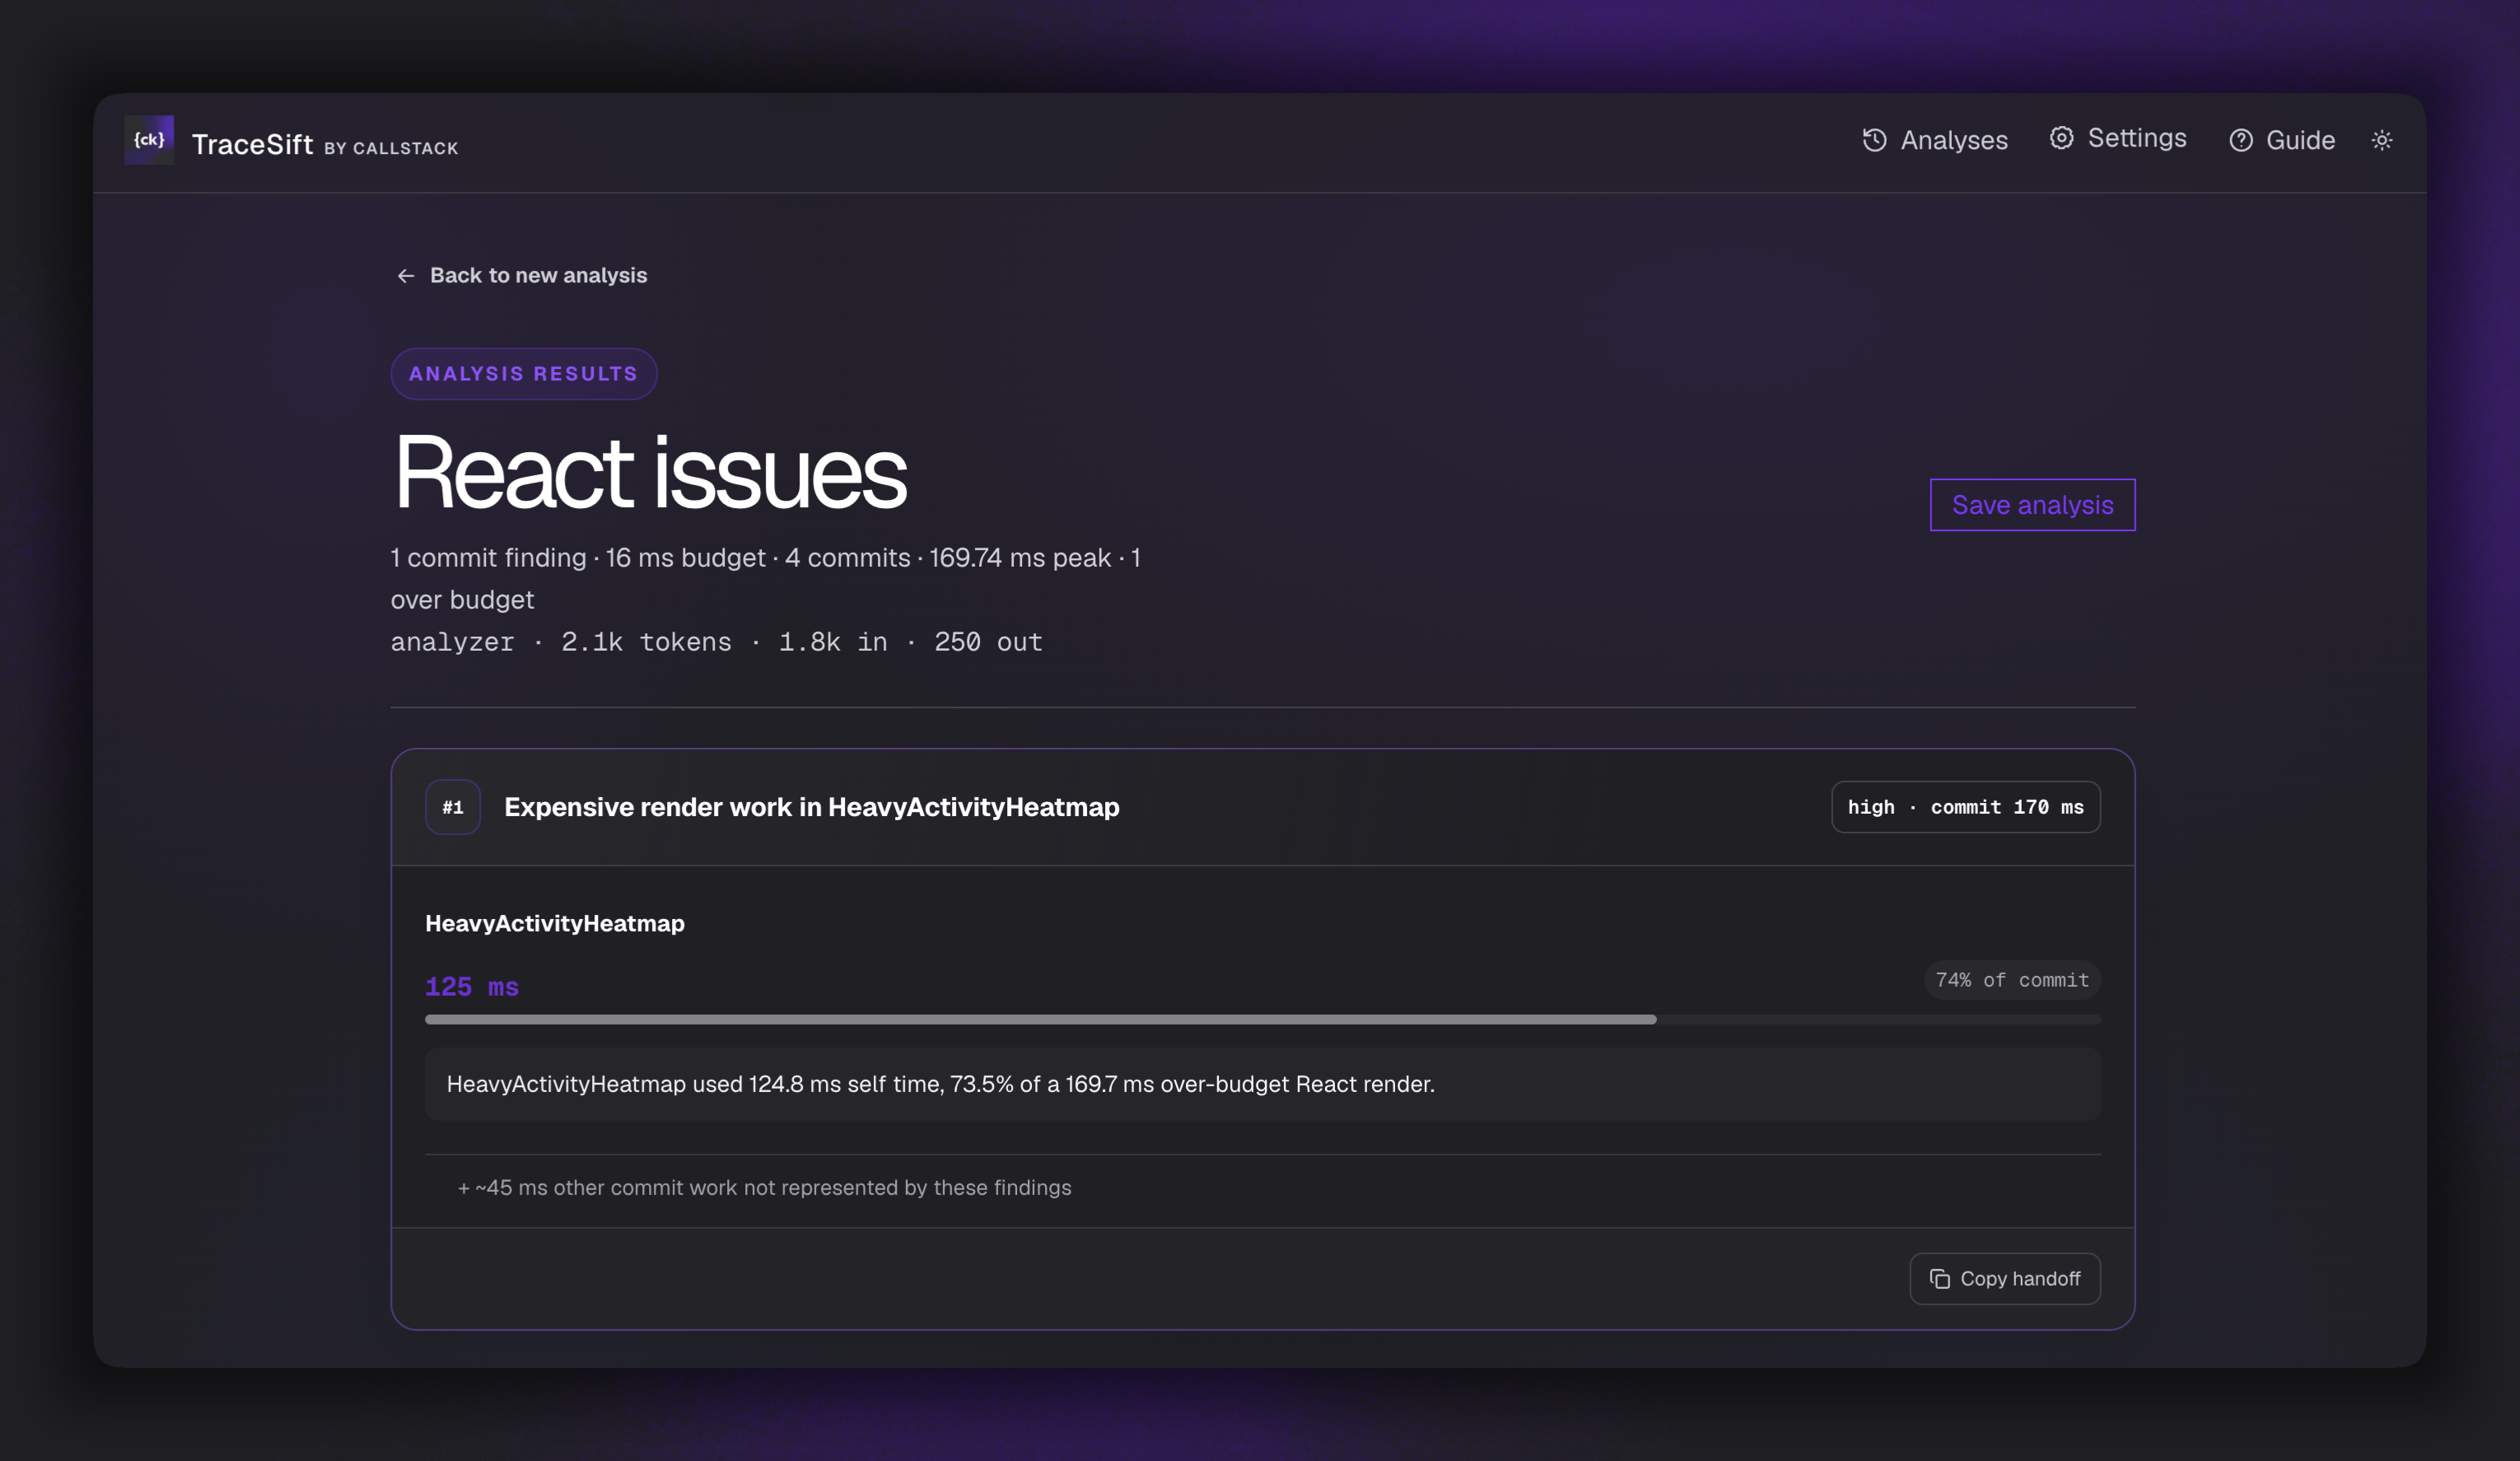
Explain with AI sends that one task or commit — its timeline and culprits, framework and engine frames collapsed away — to your configured model, which answers with a few short technical bullets on what the issue is and where it comes from.
- The reading renders above the card's rows, labelled as a reading rather than a measurement; the card keeps its measured heading.
- It is a button rather than part of the upload because only some cards on a page are worth a model call, and which ones is your call.
- A card that has been read carries its reading as the first section of the copied hand-off, above the measured evidence an agent can check it against.
Choose the card you want to investigate and select Copy Prompt. The prompt is written for an agent holding your codebase:
- the measured figures, and the culprit frames with the callers that locate them;
- one merged tree — Where those frames sit — joining the task root to every culprit, rather than a separate stack per frame;
- bundled frames named by chunk and position (
vendors.bundle.js:189:701931) instead of a full hashed URL, while a path you can actually open is still printed whole.
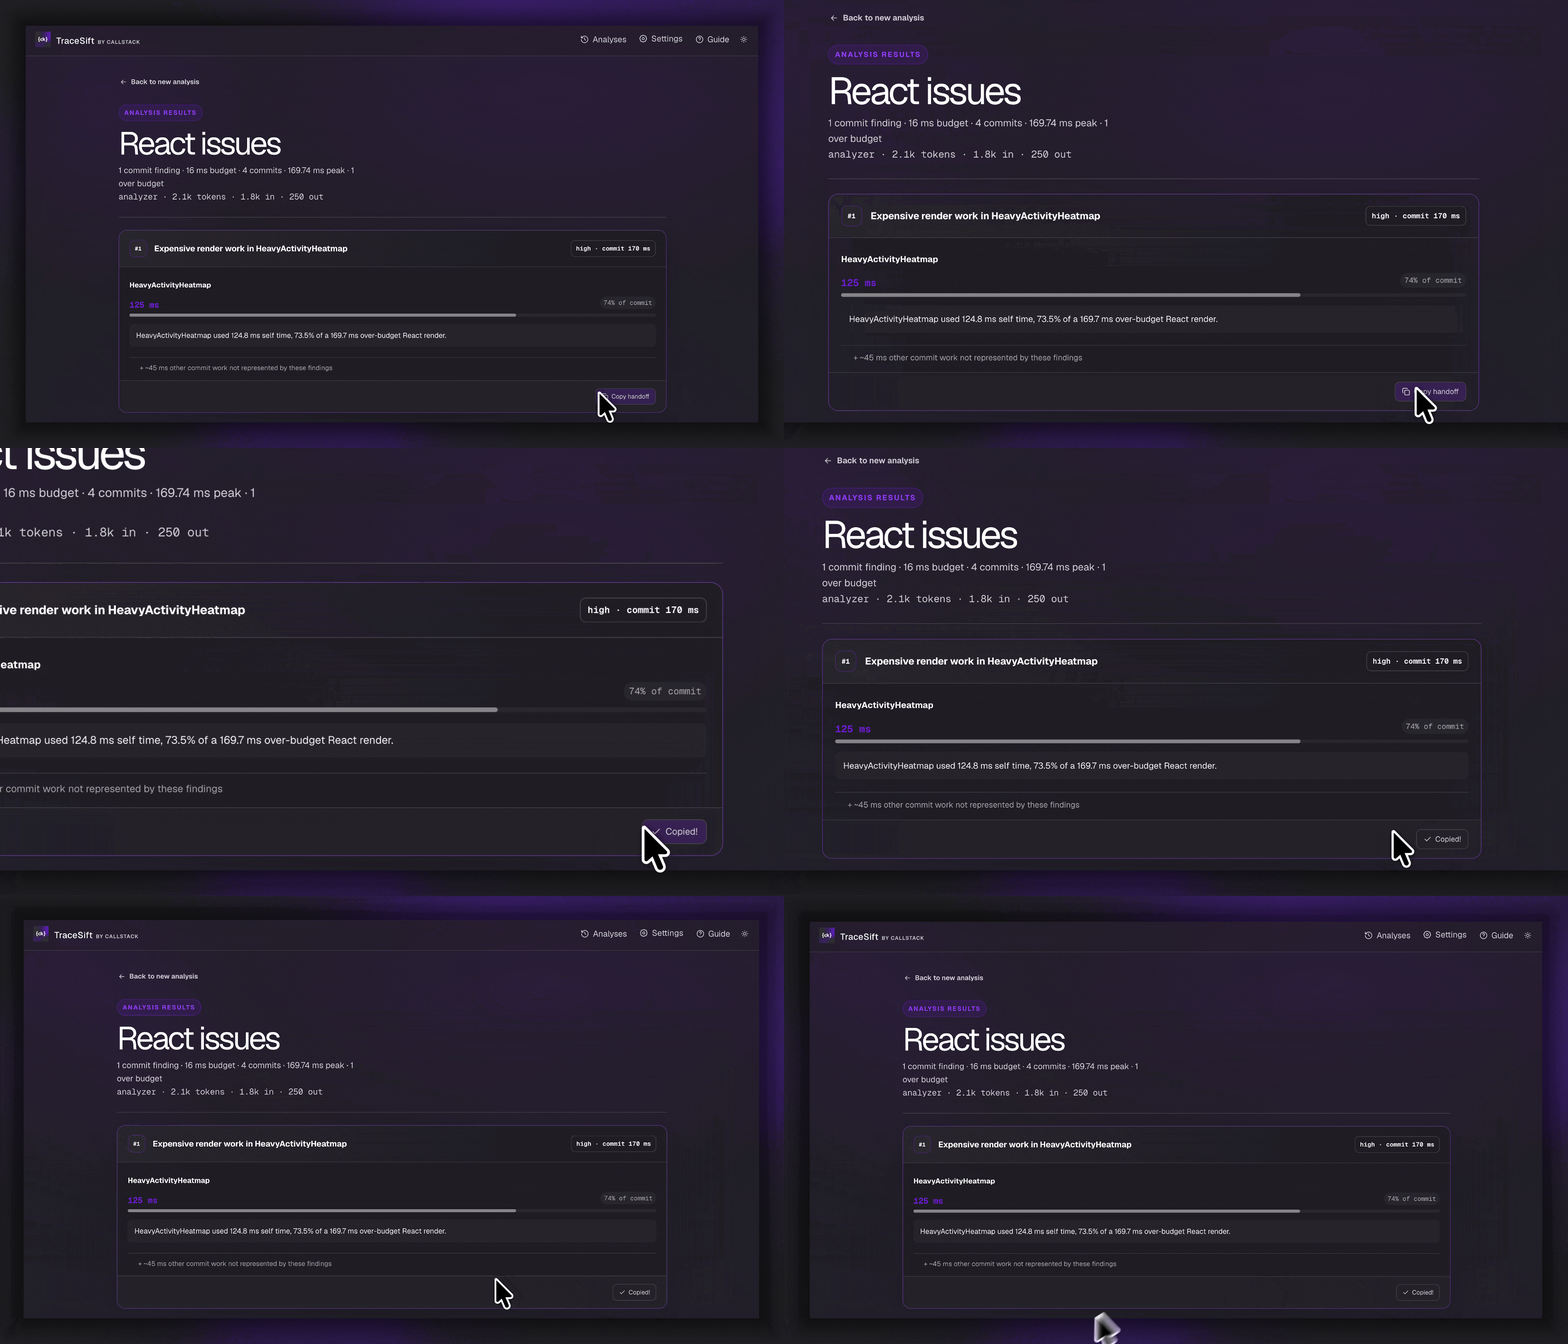
Explore opens that task or commit in a new tab, with the card's numbers at the top and the recording underneath. It answers what a card cannot: what else ran, and in what order.
For a CPU or Hermes task:
- Timeline — the task against the clock, so a function called five hundred times reads differently from one long call.
- Flame graph — the same frames drawn by eye, zoomable on a
1×–64×ladder. Click a frame to lay the graph out across its subtree (Esc, or thezoomed intobutton, to come back), or hold ⌘/Ctrl and scroll to stretch the whole graph about the pointer so thin frames widen where they sit. - Call tree — self and inclusive time per frame, where
total = self + sum(children)holds exactly. - Culprits — the ranked table behind the card's rows, with the callers that locate each frame.
Clicking into a frame gives that subtree its own Flame graph, Call tree, and Repeated work views.
A React commit opens on its commit timeline, with Render tree and Components tabs.
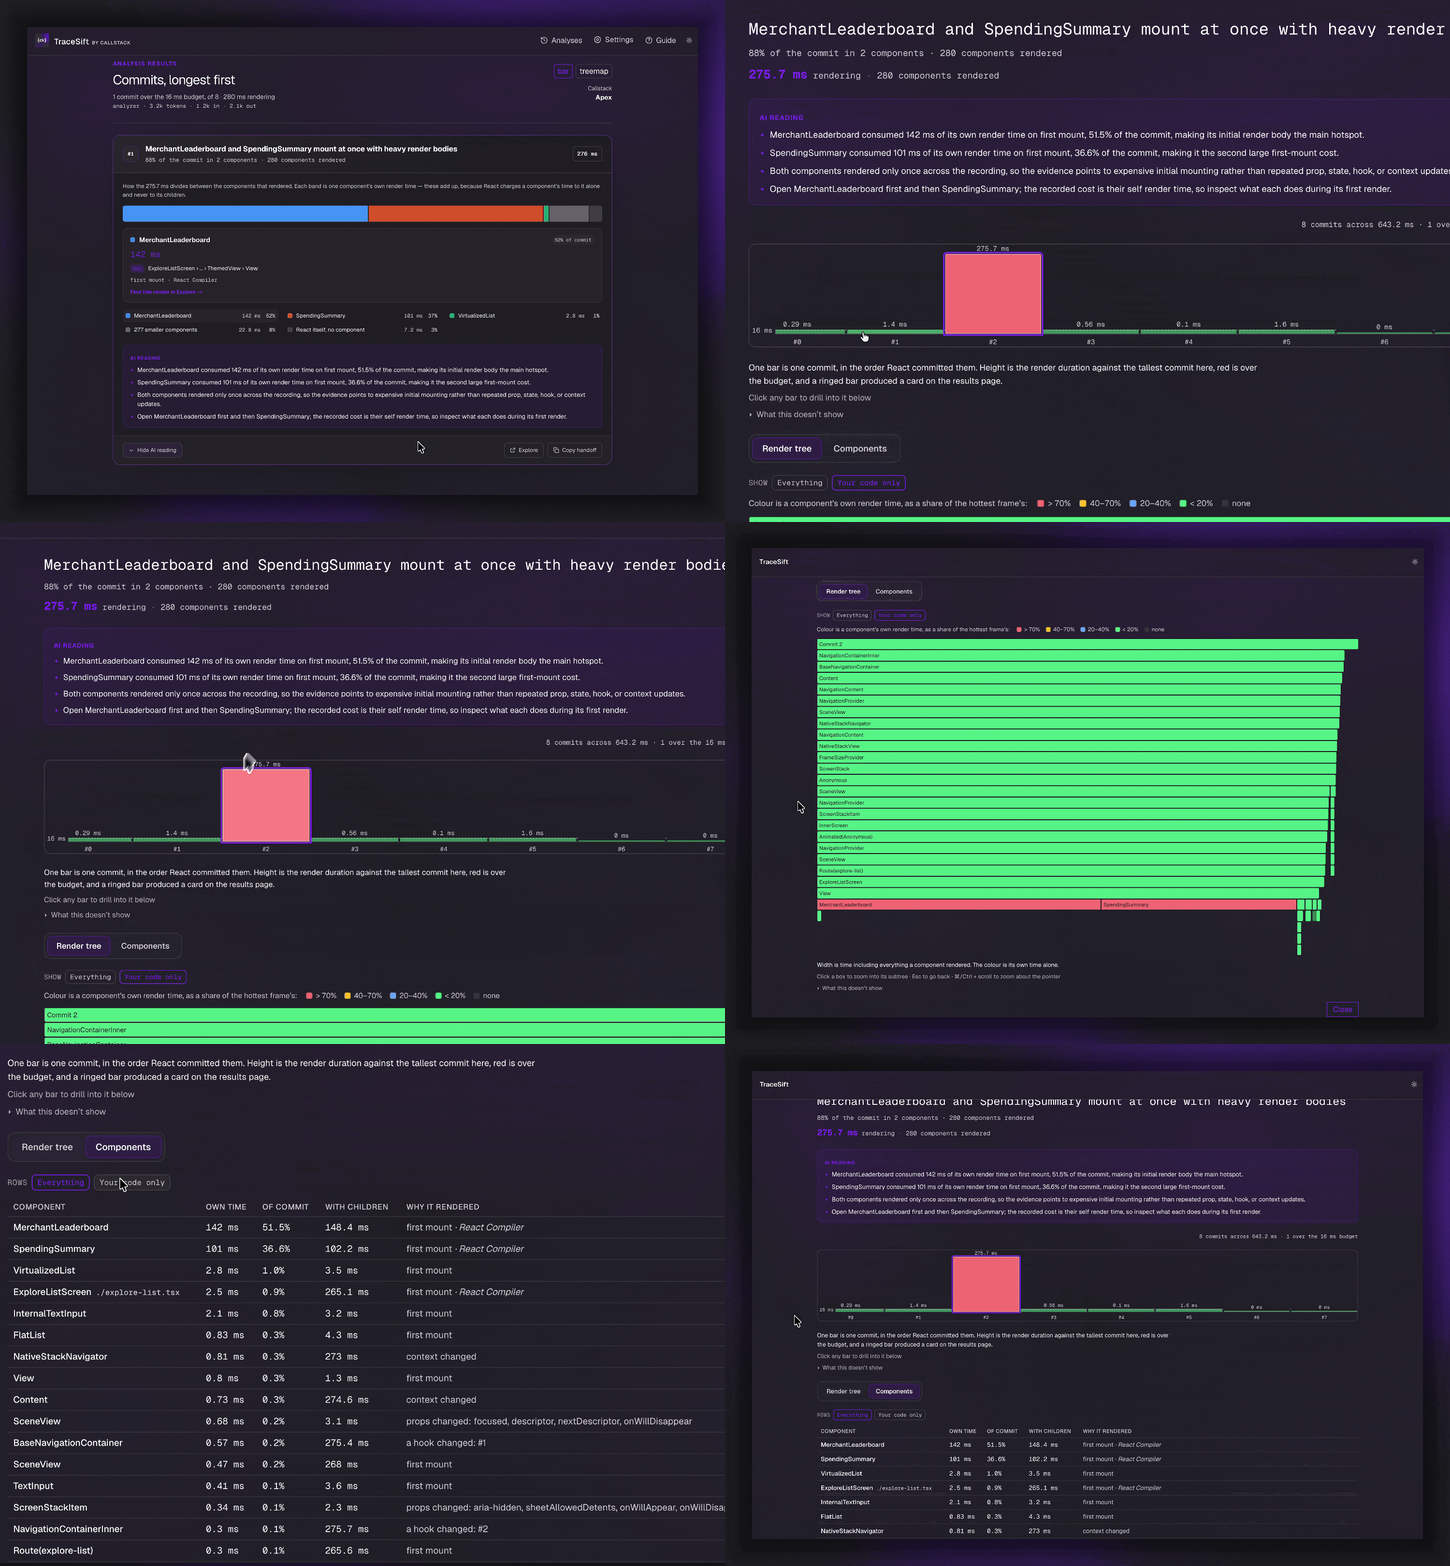
Every tree, table, and flame graph has an Everything / Your code only toggle. Collapsing a frame lifts its children into its place and charges the time it spent in its own body to the nearest kept frame above it, so the figures agree across every view.
Tip
Each chart states how to read it in one line, keeps its controls beside that, and folds its caveats behind What this doesn't show.
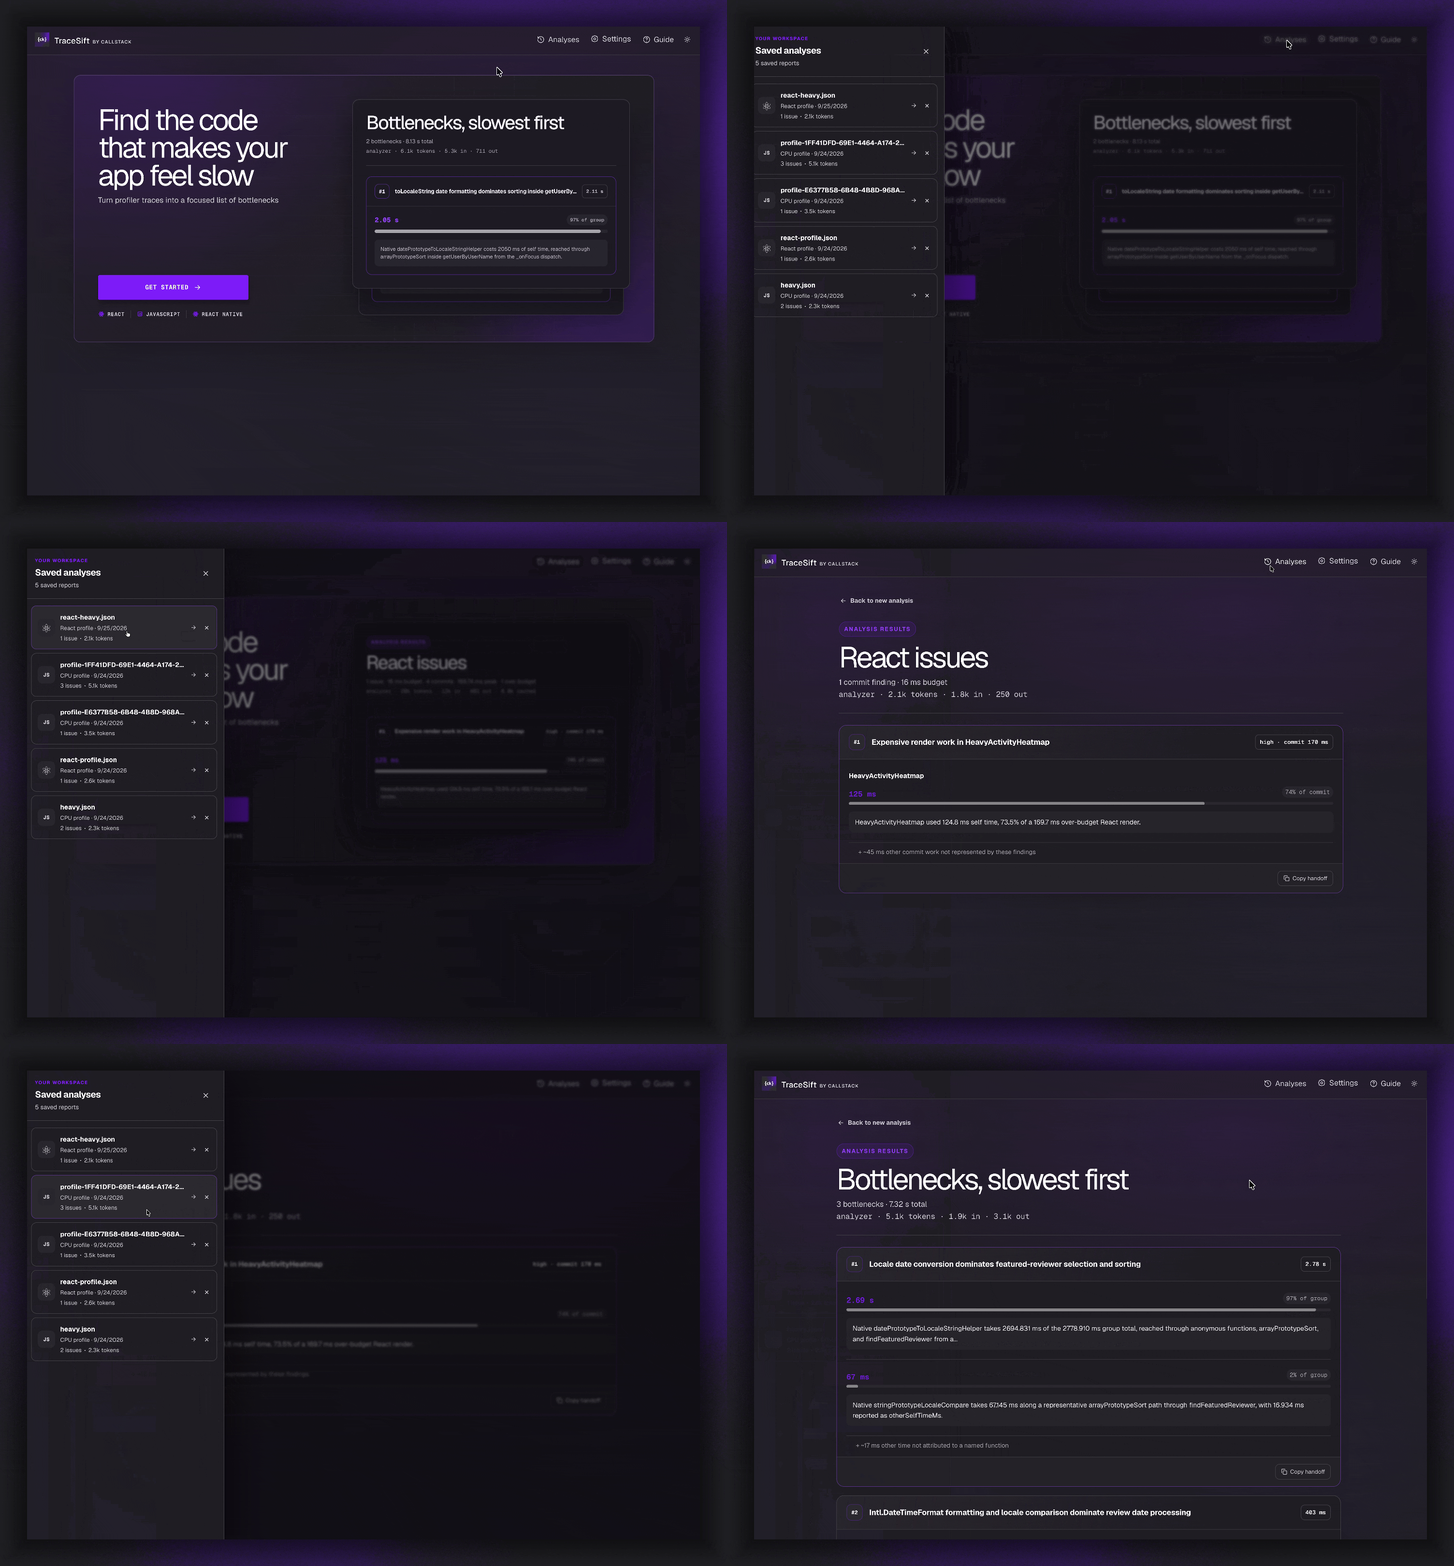
Open Analyses to browse locally saved reports, including their findings and generated prompts. Select a report to reopen it, or delete reports you no longer need.
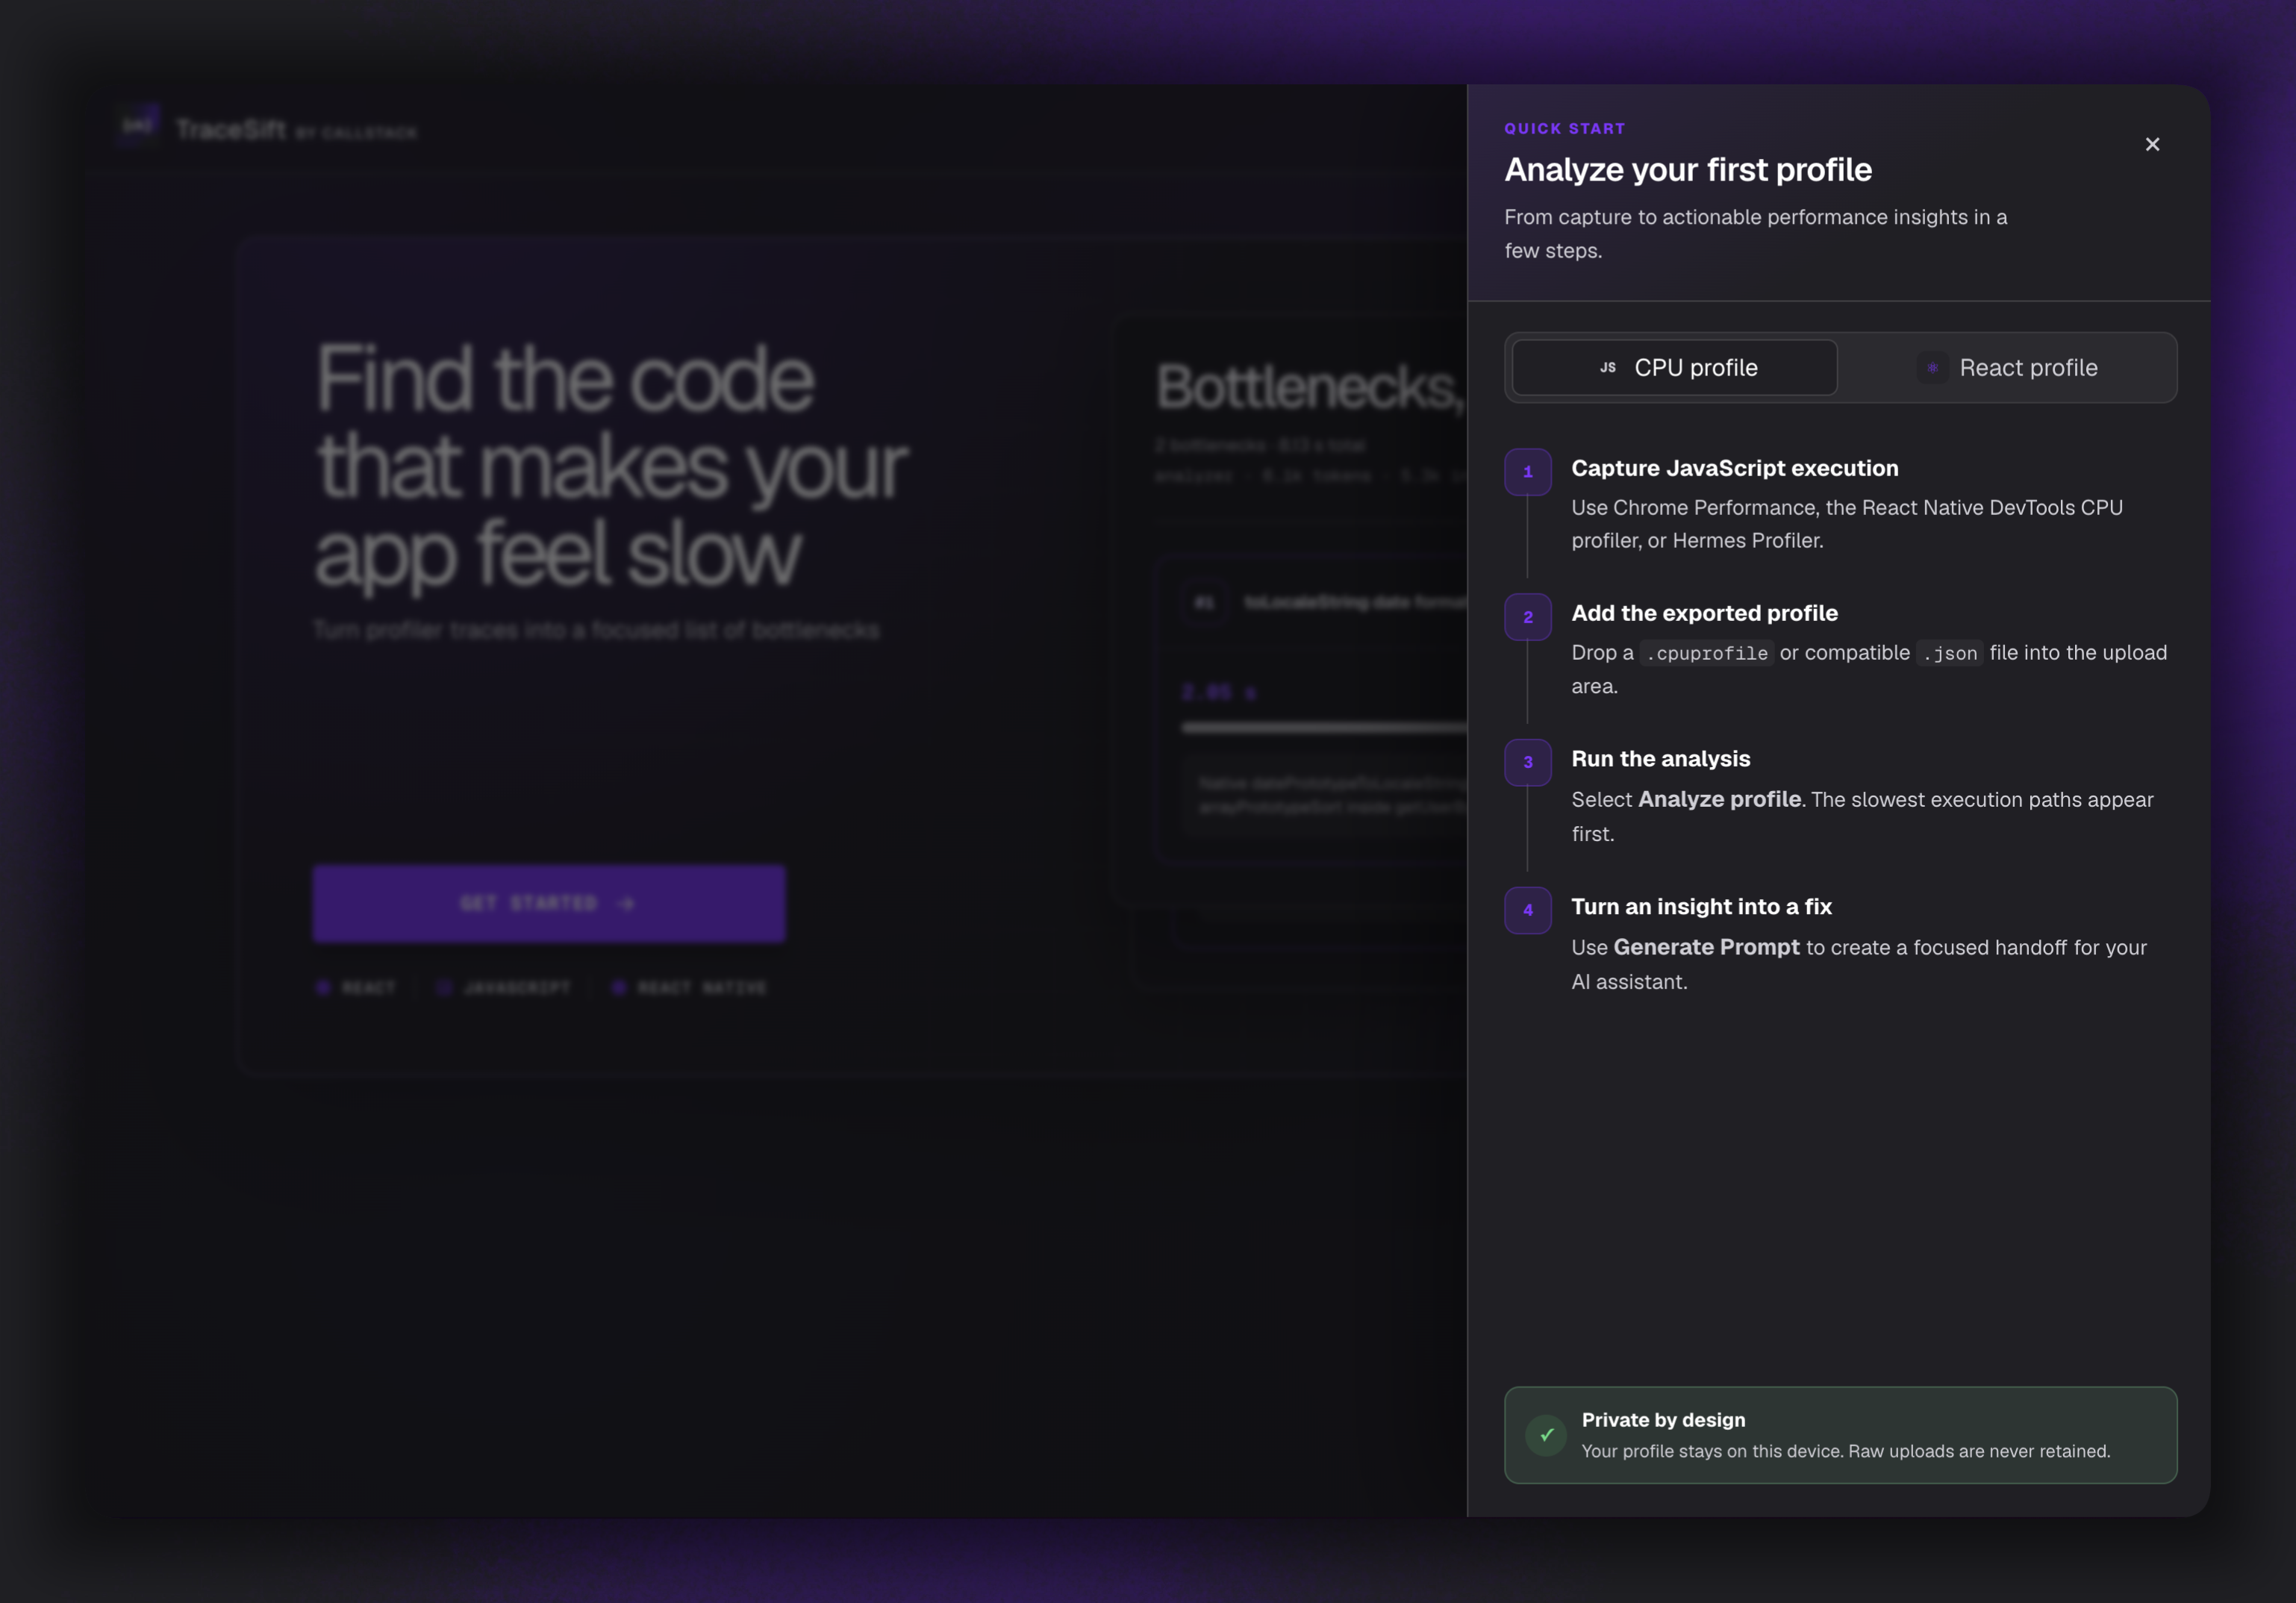
Select Guide for built-in, step-by-step instructions for capturing and analyzing JavaScript CPU, Hermes, and React profiles.
See CONTRIBUTING.md for setup, manual testing, automated checks, and testing the managed CLI installation.
The CLI package lives in packages/cli; it exports shared configuration, catalog, and server-runtime modules and uses the same pinned agent SDK version as the app.
The analysis engines are deterministic and covered by tests under tests/:
src/lib/task-cards.tsandsrc/lib/call-tree.tsbuild the CPU and Hermes cards;src/lib/react-cards.tsandsrc/lib/react-commit-tree.tsbuild the React ones;src/lib/task-timeline.tsandsrc/lib/react-explore.tsback the Explore views.
Note
TRACESIFT_CPU_ENGINE=legacy and TRACESIFT_REACT_ENGINE=analyzer run the previous model-backed engines, so a suspicious profile can be checked against them.
TraceSift is an open source project and will always remain free to use. If you think it's cool, please star it 🌟.
Callstack is a group of React and React Native geeks, contact us at hello@callstack.com if you need any help with these or just want to say hi!
MIT