Currently the Performance page shows parallel bar charts for Performance.
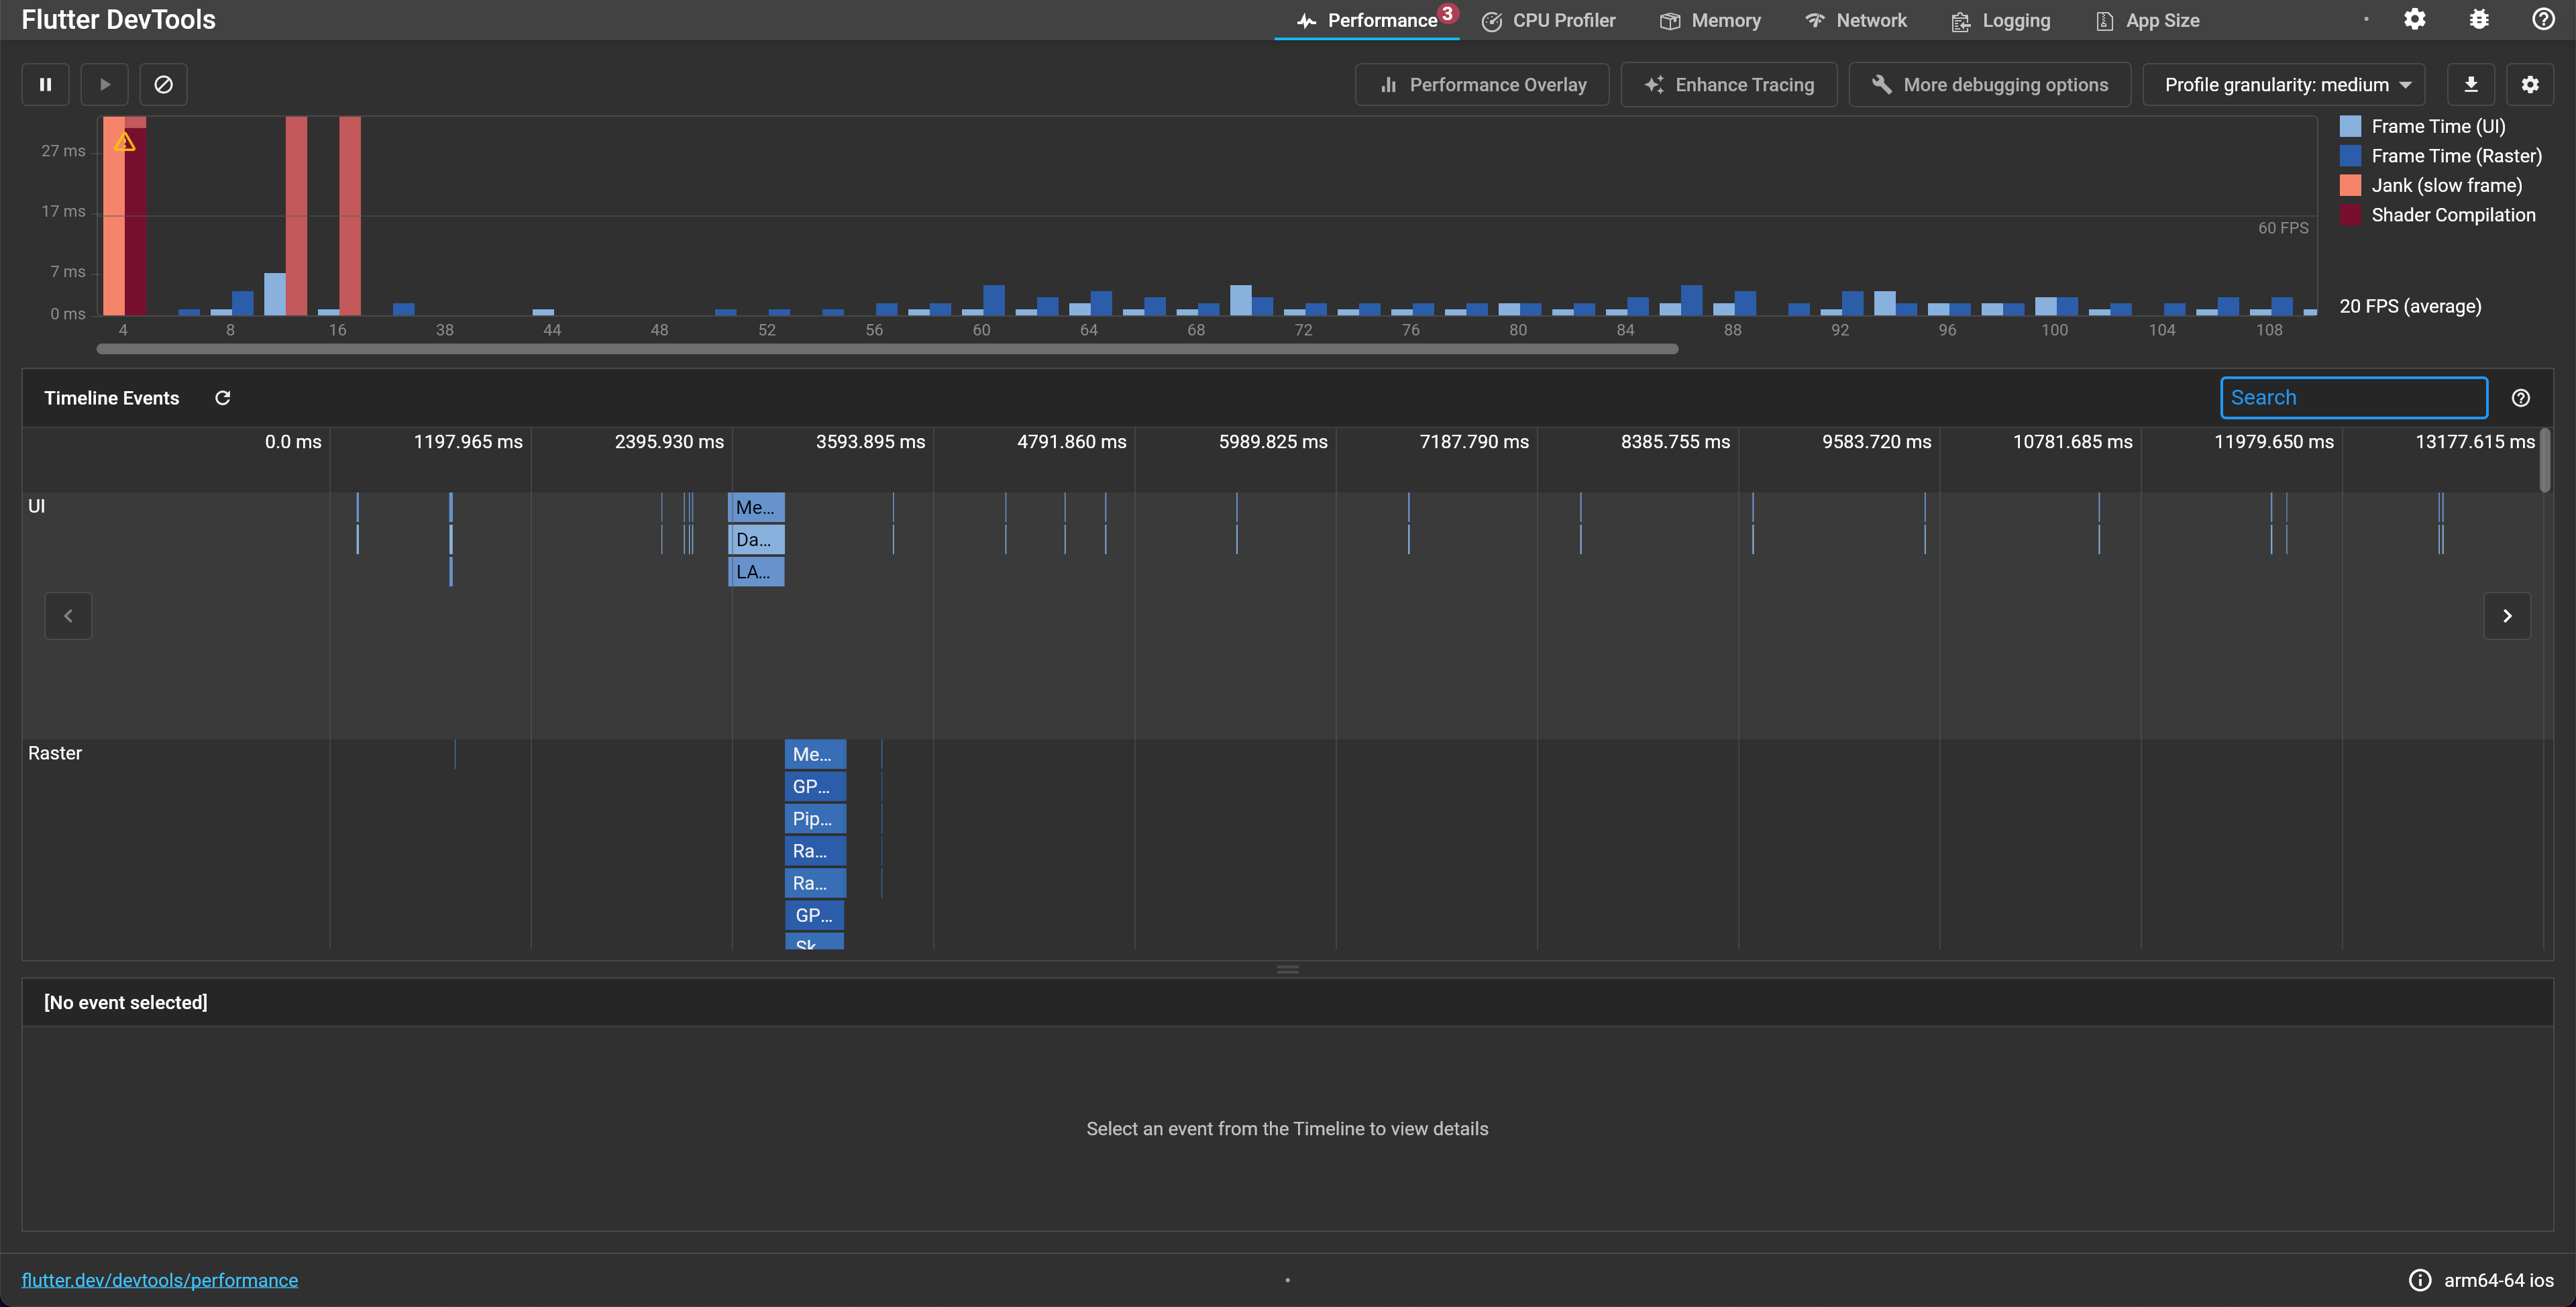
It would be much more useful if these were instead a Stacked Area Chart. That way it's easier to see how much time is being spent on each frame in total instead of having to calculate the sums in your head. It also scales better as we add more fields like shader compilation or garbage collection time.
See the wikipedia page for an example of a Stacked Area Chart: https://en.wikipedia.org/wiki/Area_chart
cc @iskakaushik
Currently the Performance page shows parallel bar charts for Performance.

It would be much more useful if these were instead a Stacked Area Chart. That way it's easier to see how much time is being spent on each frame in total instead of having to calculate the sums in your head. It also scales better as we add more fields like shader compilation or garbage collection time.
See the wikipedia page for an example of a Stacked Area Chart: https://en.wikipedia.org/wiki/Area_chart
cc @iskakaushik